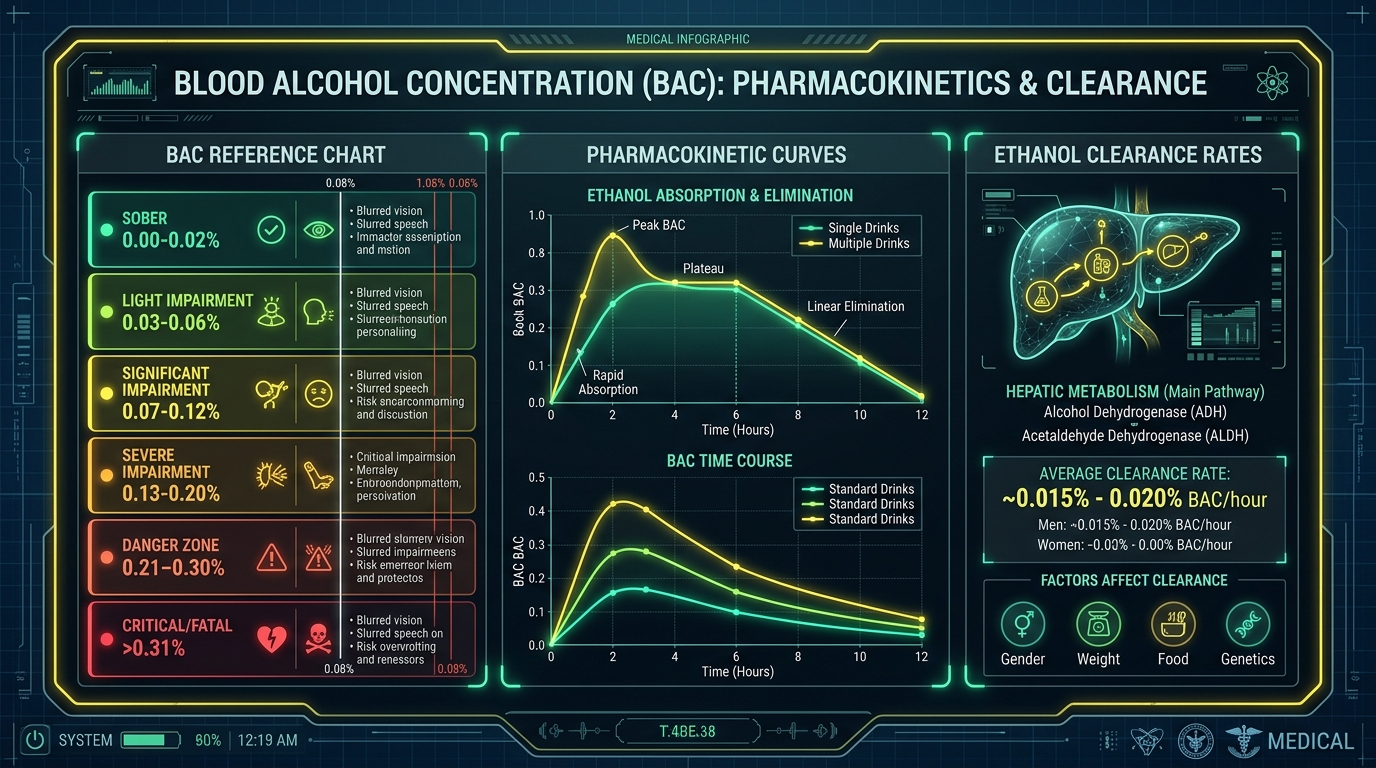
A blood alcohol concentration (bac) calculator chart estimates your circulating ethanol percentage based on body weight, biological sex, and standard drinks consumed. Because the liver clears alcohol at roughly 0.015% per hour, a 160-lb male reaches approximately 0.046% after two drinks, while a 140-lb female reaches approximately 0.065% under identical intake.
Forensic toxicologists and clinical researchers rely on the Widmark pharmacokinetic distribution model to predict ethanol diffusion across human tissue. While an interactive blood alcohol concentration bac calculator provides personalized dynamic modeling, having a standardized reference chart offers an immediate, visual understanding of how beverage quantity and physical mass shape acute intoxication.
This comprehensive guide presents verified male and female BAC tables, details the physiological stages of alcohol impairment, explains the mathematical basis of ethanol clearance, and outlines why real-life biological factors cause your actual BAC to deviate from theoretical averages.
What Is a Blood Alcohol Concentration (BAC) Calculator Chart?
In clinical and forensic toxicology, Blood Alcohol Concentration (BAC) represents the mass of ethyl alcohol (ethanol) measured in grams per 100 milliliters (or 1 deciliter) of circulating blood.
A blood alcohol level chart provides a multi-variable grid cross-referencing three primary factors:
- Total Standard Drink Units: In the United States, each standard drink contains exactly 14.0 grams (0.6 fluid ounces) of pure ethanol.
- Total Body Weight: Grouped typically from 100 lbs (45 kg) to 240 lbs (109 kg) in 20-lb increments.
- Biological Sex: Accounting for fundamental population averages in adipose-to-lean muscle ratios and Total Body Water (TBW).
Unlike casual guessing games or arbitrary rules of thumb, a scientifically verified chart translates the volume of ingested ethanol into an estimated peak blood concentration prior to the onset of hepatic metabolism.
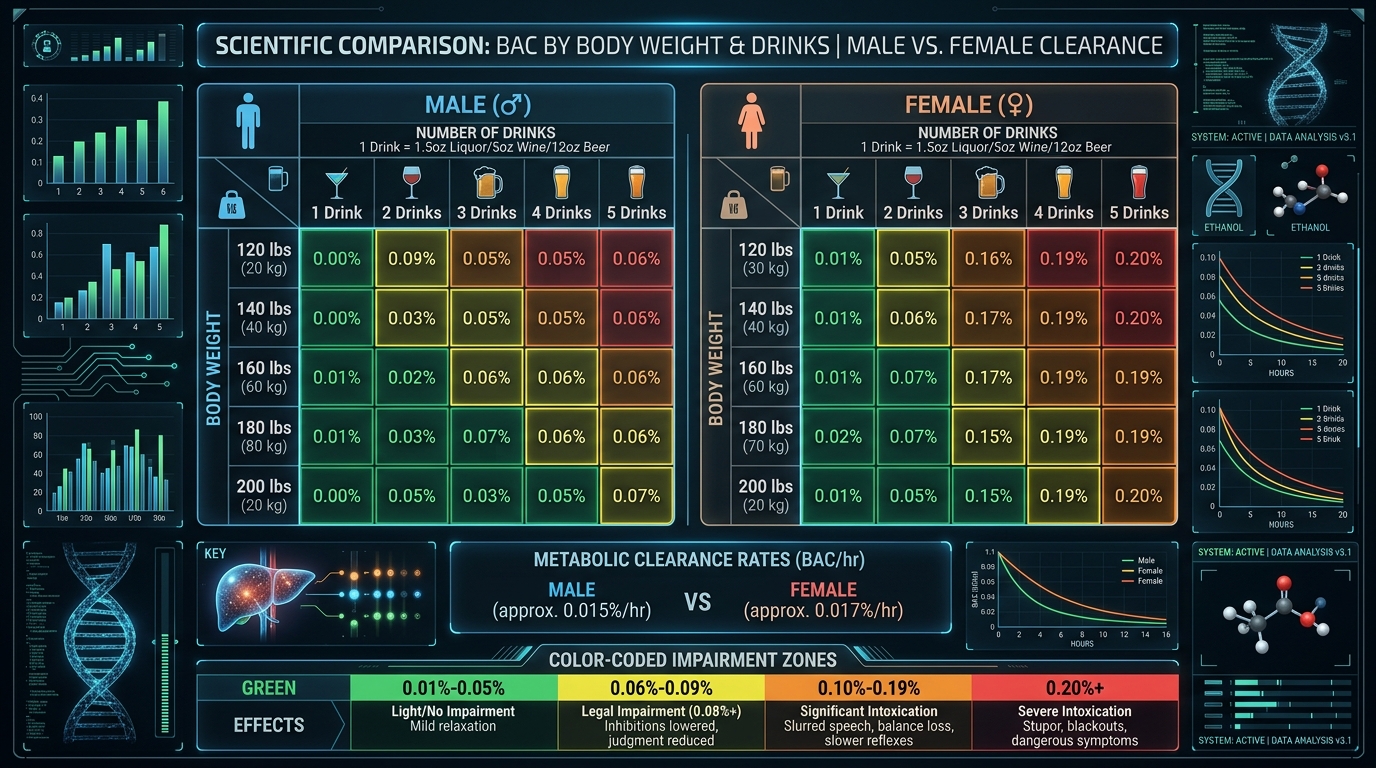
Male vs. Female BAC Reference Matrix: Body Weight vs. Drinks
The following reference matrices outline estimated peak BAC levels immediately after consuming 1 to 6 standard drinks within a one-hour window. These figures reflect population baseline distribution constants (r = 0.68 for biological males, r = 0.55 for biological females) using Erik Widmark’s standardized pharmacokinetic equation.
1. BAC Reference Table for Biological Females
Due to higher average body fat percentages and lower total body water volume (approximately 52% water compared to 61% in men), biological females achieve higher peak BAC values per drink than males of identical weight:
| Weight | 1 Drink | 2 Drinks | 3 Drinks | 4 Drinks | 5 Drinks | 6 Drinks |
|---|---|---|---|---|---|---|
| 100 lbs (45 kg) | 0.045% | 0.091% | 0.136% | 0.182% | 0.227% | 0.273% |
| 120 lbs (54 kg) | 0.038% | 0.076% | 0.113% | 0.151% | 0.189% | 0.227% |
| 140 lbs (64 kg) | 0.032% | 0.065% | 0.097% | 0.130% | 0.162% | 0.195% |
| 160 lbs (73 kg) | 0.028% | 0.057% | 0.085% | 0.114% | 0.142% | 0.170% |
| 180 lbs (82 kg) | 0.025% | 0.051% | 0.076% | 0.101% | 0.126% | 0.151% |
| 200 lbs (91 kg) | 0.023% | 0.045% | 0.068% | 0.091% | 0.114% | 0.136% |
| 220 lbs (100 kg) | 0.021% | 0.041% | 0.062% | 0.083% | 0.103% | 0.124% |
2. BAC Reference Table for Biological Males
Biological males average approximately 60% to 68% total body water by weight. This larger aqueous volume distributes ingested alcohol across a wider vascular reserve:
| Weight | 1 Drink | 2 Drinks | 3 Drinks | 4 Drinks | 5 Drinks | 6 Drinks |
|---|---|---|---|---|---|---|
| 100 lbs (45 kg) | 0.037% | 0.073% | 0.110% | 0.147% | 0.183% | 0.220% |
| 120 lbs (54 kg) | 0.031% | 0.061% | 0.092% | 0.122% | 0.153% | 0.183% |
| 140 lbs (64 kg) | 0.026% | 0.052% | 0.079% | 0.105% | 0.131% | 0.157% |
| 160 lbs (73 kg) | 0.023% | 0.046% | 0.069% | 0.092% | 0.114% | 0.137% |
| 180 lbs (82 kg) | 0.020% | 0.041% | 0.061% | 0.081% | 0.102% | 0.122% |
| 200 lbs (91 kg) | 0.018% | 0.037% | 0.055% | 0.073% | 0.092% | 0.110% |
| 220 lbs (100 kg) | 0.017% | 0.033% | 0.050% | 0.067% | 0.083% | 0.100% |
Elimination Rule: Subtract approximately 0.015% BAC for each hour that elapses after taking your first sip. Red numbers indicate values that meet or exceed the 0.08% legal driving limit.
What Defines a "Standard Drink" on a BAC Chart?
A major point of confusion when reading a printable bac chart is assuming one container equals one drink. Many commercial beers and cocktails contain double or triple the ethanol of a standard unit.
In the United States, the National Institute on Alcohol Abuse and Alcoholism (NIAAA) benchmarks one standard drink as containing exactly 14.0 grams (0.6 fluid ounces) of pure ethanol:
- Domestic Light Beer: 12 fluid ounces (355 mL) at 4.2% – 5.0% ABV = 1.0 standard drink.
- Table Wine: 5 fluid ounces (148 mL) at 12.0% ABV = 1.0 standard drink.
- Distilled Spirits (80 Proof): 1.5 fluid ounce shot (44 mL) at 40.0% ABV = 1.0 standard drink.
- Craft Double IPA: 16 fluid ounce pint (473 mL) at 8.5% ABV = 2.3 standard drinks in a single glass.
- Restaurant Cocktails: Drinks such as Long Island Iced Teas or Margaritas often pack 3 to 4 oz of spirits = 2.0 to 2.7 standard drinks.
To convert diverse beverage volumes and custom ABV percentages into exact units before checking this chart, use our dedicated Standard Drink Calculator.
The Six Clinical Stages of Alcohol Impairment
Circulating ethanol depresses the central nervous system by stimulating inhibitory GABA neuroreceptors and dulling excitatory NMDA pathways. Cognitive and motor decline follow predictable clinical stages:
| BAC Range (%) | Clinical Stage | Neurological & Physical Symptoms | Motor Vehicle Operation Risk |
|---|---|---|---|
| 0.01% – 0.03% | Subclinical | Mild relaxation; slight elevation in heart rate; no outward impairment. | Subtle reduction in multi-tasking and divided attention. |
| 0.04% – 0.06% | Euphoria | Mild impairment of reasoning; exaggerated emotions; reduced fine coordination. | Slowed emergency braking reaction times; reduced hazard perception. |
| 0.07% – 0.09% | Excitement / DUI Limit | Balance and speech noticeably impaired; reaction times lengthened; sensory blunting. | Statutory DUI threshold (0.08%). 4x crash probability multiplier. |
| 0.10% – 0.15% | Early Ataxia | Gross motor control loss; slurred speech; severe loss of balance; delayed perception. | Extreme crash hazard; inability to process emergency road cues. |
| 0.16% – 0.25% | Confusion / Blackout | Anterograde amnesia (blackout); severe disorientation; nausea and vomiting. | Catastrophic motor impairment; complete loss of vehicular control. |
| 0.26% – 0.35%+ | Stupor to Coma | Unresponsiveness; loss of motor function; risk of respiratory depression and death. | Life-threatening medical emergency requiring immediate 911 intervention. |
The Elimination Rate: How Fast Does BAC Drop Over Time?
Unlike most medications that clear via concentration-dependent half-lives, alcohol is metabolized predominantly by the liver enzyme alcohol dehydrogenase (ADH) under zero-order kinetics.
Because hepatic enzymes become saturated at minimal alcohol concentrations (~0.02% BAC), the liver clears alcohol at a steady, fixed rate:
Hepatic Elimination Rate (β) ≈ 0.015% BAC per hourFor example, if an individual reaches a peak BAC of 0.090%:
- After 2 hours: BAC drops by
0.030%to 0.060%. - After 4 hours: BAC drops by
0.060%to 0.030%. - After 6 hours: BAC reaches 0.000%.
To calculate exact personal elimination curves, use our Alcohol Metabolism Calculator.
Why Real-Life BAC Differs from Static Reference Charts
Clinical studies demonstrate that actual breath or blood alcohol measurements frequently vary by ±15% to 30% from theoretical charts due to biological nuances:
- Food in the Stomach: Consuming a meal rich in proteins and fats closes the pyloric sphincter, delaying absorption by 60 to 90 minutes and lowering peak BAC amplitude by up to 25% through gastric ADH breakdown.
- Body Composition (Muscle vs. Fat): Lean muscle tissue contains approximately 75% water, whereas body fat contains only 10% to 15% water. Two individuals of identical weight can register different BAC levels if their lean-to-adipose ratios differ.
- Beverage Carbonation: Carbonated alcoholic drinks (sparkling wine, seltzers, liquor mixed with soda) accelerate gastric emptying into the small intestine, spiking peak BAC faster than flat beverages.
- Medications and Liver Function: Antihistamines, H2 blockers, and enzyme-inhibiting drugs alter gastric and hepatic breakdown speeds.
Critical Public Safety Reminder:
Under no circumstances should any static BAC chart or online calculator be used to determine fitness or legal permission to operate a motor vehicle or machinery. Sensory impairment and delayed hazard reaction begin at BAC levels as low as 0.02%. Always designate a sober driver or use commercial transport services.
Frequently Asked Questions About BAC Charts
Explore Interactive BAC Calculators & Clinical Guides:
- Interactive BAC Calculator Tool — Input exact weight, beverage styles, and timeline for customized Widmark modeling.
- Standard Drink Calculator — Convert craft beer, wine, and liquor servings into standardized 14g ethanol units.
- Alcohol Metabolism & Clearance Calculator — Model zero-order hepatic oxidation curves and sobriety timelines.
- How to Calculate BAC Level Guide — Full mathematical breakdown of the Widmark equation with clinical examples.
- Blood Alcohol Concentration to Promille & German Driving Limits — Convert percentage BAC to European Promille units and review German traffic regulations.